ONLINE PORTFOLIO
Alpine Capital operates Multi Asset Class Portfolios (MAP's) as an exceptional way to manage clients’ “Core” wealth. MAP portfolios are a low-cost wealth management solution backed by leading research, are highly diversified across asset classes, and have generated high returns above objectives.
MAP portfolios are available online through the Open Wealth platform. This creates a very cost effective way to access professionally managed portfolios, even for smaller amounts down to $10,000. Account opening takes less than 10 minutes.
MAP Benefits

9yr+ History of Performance

Choice of 4 Investment Portfolios

Enables Core Portfolio Management

Online - Open an account in 10 mins

No Entry, Exit or Switching Fees

Full Reporting Including

Retain Beneficial Ownership

Backed by Leading Research

Lower Cost Approach

Secure and Fully Diversified

Strong Historical Performance*

Experienced Management Team
MAP Performance
Model Portfolio Performance+
Month
April 2025*
Quarter
6 Months
1 Year
2 Years
5 Years
10 Years
Since Inception
Annualised
Absolute
Inception August 2012
Rolling Performance
Annualised % PA
Absolute/years since inception
Conservative
0.31%
-1.12%
1.18%
5.7%
5.91%
5.03%
5.10%
6.48%
9.6%
122.8%
Balanced
0.01%
-2.66%
-0.19%
5.23%
6.09%
6.42%
5.69%
7.71%
12.4%
157.8%
Growth
-0.3%
-3.13%
-0.52%
6.12%
6.96%
7.4%
6.26%
8.73%
15%
190.9%
High Growth
-0.86%
-4.83%
-1.49%
5.97%
8.24%
8.15%
7.06%
9.76%
17.9%
227.8%
Past performance is no guarantee of future results
Notes* Past performance is no guarantee of future results.
+ + Since Inception on the 1st August 2012. Historical data prior to moving to OpenWealth in September 2021. Historically the model portfolios are rebalanced quarterly (31 Mar, 30 Jun, Sep and 31 Dec) and when changes to the portfolios are made. Historically performance is calculated as Total Shareholder Return, excluding costs, and therefore captures capital growth/loss + dividends (but excludes the benefit of franking credits). IMPORTANT INFORMATION
i. As at the 1St October 2021, Alpine Capital Securities is utilising a new investment platform, OpenInvest Pty Ltd (OpenWealth), and will be replicating 4 of the Model Portfolios managed by Alpine Capital Securities, namely Alpine Capital MAP - Conservative, Balanced, Growth and High Growth.
ii. The published returns for Model Portfolios have been calculated linking the past performance of the Alpine Capital Securities MAP Model Portfolios, offered directly to Alpine Capital Securities clients, and reported through the ShareSight Pro reporting platform prior to 1St October 2021.
iii. Past performance is not a reliable indicator of future performance, and the above information is of a general nature only and should not be considered as personal financial advice that takes into account your individual objectives, needs or circumstances.
iv. The historical data prior to moving to OpenWealth on 1St October 2021 is unaudited and does not deduct the management fee included in OpenWealth Performance. Prior to moving to OpenWealth, the model portfolios are rebalanced quarterly (31 Mar, 30 Jun, Sep and 31 Dec) or when changes to the portfolios were made. Historically performance was calculated as Total Shareholder Return, excluding costs, and therefore captures capital growth/loss + dividends (but excludes the benefit of franking credits). Distributions are assumed to have been reinvested whilst no allowance has been made for tax. The inception date for the model portfolios is 1st August 2012
Model Portfolio Performance+
Conservative
Balanced
Growth
High Growth
Month
June 2025*
-0.69%
1.01%
0.74%
0.51%
Quarter
3.29%
4.31%
4.22%
4.34%
6 Months
3.56%
3.87%
3.98%
3.41%
1 Year
8.07%
8.78%
9.69%
10.64%
2 Years
7.53%
8.26%
9.42%
10.87%
5 Years
5.35%
6.81%
7.86%
8.84%
10 Years
6.13%
7.37%
8.22%
8.84%
Since Inception
6.68%
8.01%
9.05%
10.03%
Annualised
10.1%
13.2%
15.9%
19.1%
Absolute
129.50%
168.9%
204.1%
245.0%
Past performance is no guarantee of future results
Notes* Past performance is no guarantee of future results.
+ + Since Inception on the 1st August 2012. Historical data prior to moving to OpenWealth in September 2021. Historically the model portfolios are rebalanced quarterly (31 Mar, 30 Jun, Sep and 31 Dec) and when changes to the portfolios are made. Historically performance is calculated as Total Shareholder Return, excluding costs, and therefore captures capital growth/loss + dividends (but excludes the benefit of franking credits). IMPORTANT INFORMATION
i. As at the 1St October 2021, Alpine Capital Securities is utilising a new investment platform, OpenInvest Pty Ltd (OpenWealth), and will be replicating 4 of the Model Portfolios managed by Alpine Capital Securities, namely Alpine Capital MAP - Conservative, Balanced, Growth and High Growth.
ii. The published returns for Model Portfolios have been calculated linking the past performance of the Alpine Capital Securities MAP Model Portfolios, offered directly to Alpine Capital Securities clients, and reported through the ShareSight Pro reporting platform prior to 1St October 2021.
iii. Past performance is not a reliable indicator of future performance, and the above information is of a general nature only and should not be considered as personal financial advice that takes into account your individual objectives, needs or circumstances.
iv. The historical data prior to moving to OpenWealth on 1St October 2021 is unaudited and does not deduct the management fee included in OpenWealth Performance. Prior to moving to OpenWealth, the model portfolios are rebalanced quarterly (31 Mar, 30 Jun, Sep and 31 Dec) or when changes to the portfolios were made. Historically performance was calculated as Total Shareholder Return, excluding costs, and therefore captures capital growth/loss + dividends (but excludes the benefit of franking credits). Distributions are assumed to have been reinvested whilst no allowance has been made for tax. The inception date for the model portfolios is 1st August 2012
Notes* Past performance is no guarantee of future results.
+ + Since Inception on the 1st August 2012. Historical data prior to moving to OpenWealth in September 2021. Historically the model portfolios are rebalanced quarterly (31 Mar, 30 Jun, Sep and 31 Dec) and when changes to the portfolios are made. Historically performance is calculated as Total Shareholder Return, excluding costs, and therefore captures capital growth/loss + dividends (but excludes the benefit of franking credits). IMPORTANT INFORMATION
i. As at the 1St October 2021, Alpine Capital Securities is utilising a new investment platform, OpenInvest Pty Ltd (OpenWealth), and will be replicating 4 of the Model Portfolios managed by Alpine Capital Securities, namely Alpine Capital MAP - Conservative, Balanced, Growth and High Growth.
ii. The published returns for Model Portfolios have been calculated linking the past performance of the Alpine Capital Securities MAP Model Portfolios, offered directly to Alpine Capital Securities clients, and reported through the ShareSight Pro reporting platform prior to 1St October 2021.
iii. Past performance is not a reliable indicator of future performance, and the above information is of a general nature only and should not be considered as personal financial advice that takes into account your individual objectives, needs or circumstances.
iv. The historical data prior to moving to OpenWealth on 1St October 2021 is unaudited and does not deduct the management fee included in OpenWealth Performance. Prior to moving to OpenWealth, the model portfolios are rebalanced quarterly (31 Mar, 30 Jun, Sep and 31 Dec) or when changes to the portfolios were made. Historically performance was calculated as Total Shareholder Return, excluding costs, and therefore captures capital growth/loss + dividends (but excludes the benefit of franking credits). Distributions are assumed to have been reinvested whilst no allowance has been made for tax. The inception date for the model portfolios is 1st August 2012
Investment Models
Investment Objective
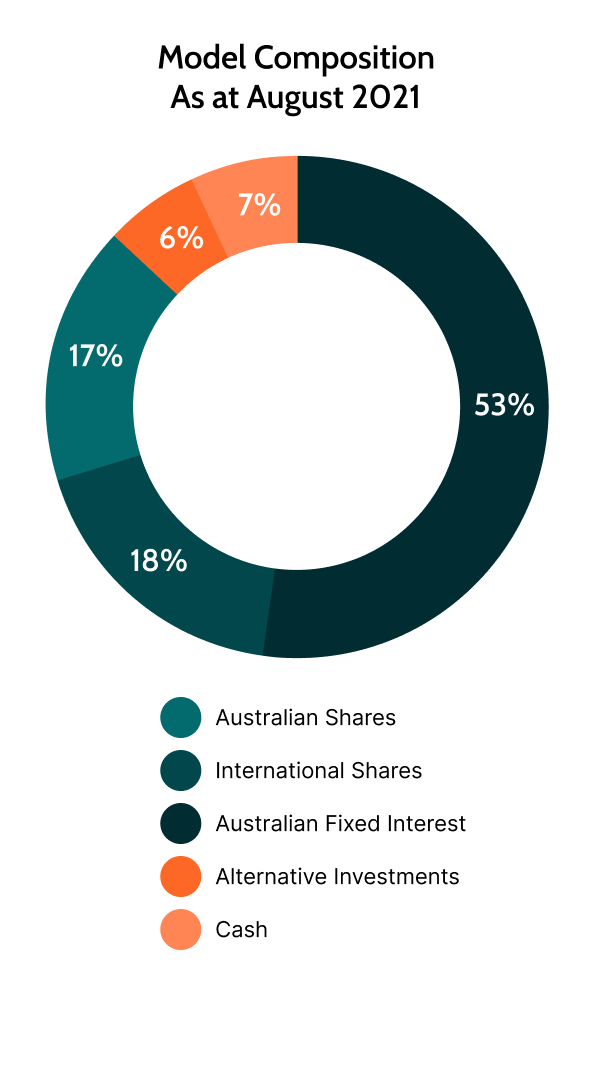
Conservative aims to return cash plus a margin of 1.75-2.25% pa over a 4–7-year period. Cash is represented by the RBA cash rate. The portfolio is constructed to provide secure regular income, a lower degree of volatility than equities, and broad diversification. Based on an assessment of the macroeconomic outlook, the portfolio looks to rebalance in order to provide an optimal allocation between defensive and growth assets. The active management approach continually assesses the outlook for risk and returns.
Typical Investor
The Conservative model is suitable for investors who prioritise capital stability, and income over the pursuit of growth. They require an experienced manager with a long-established track record and active management process, through varied market cycles and risk environments. An investor who seeks a diversified, low cost, risk-based portfolio across multiple asset classes, and backed by leading non-bank macroeconomic research. The investor is looking to access a low-cost approach to manage a “Core” part of their wealth.
Investment Strategy and Approach
Alpine’s management process creates a risk based diversified portfolio that is actively managed. Within a conservative asset allocation framework, Alpine uses an in-house Tactical Equity Asset Allocation Model (TEAA), to actively increase or decrease exposure to risk assets based on the tactical outlook over a 1-6 month period. In simple terms we look to “time” key asset class movements based on risk and reward for the asset classes.
We in part use Longview Economics Research (London) timing models as part of this decision making process. This process helps us actively manage the allocation to equities, property, fixed interest (bonds, some hybrids), alternate asset classes (i.e. gold, commodities, currencies) and cash. There are no set limits on tactical rebalancing events, however typically tactical changes occur between 5 and 10 times per year. Historically rebalancing has occurred when changes are made or quarterly.

Indicative number of holdings
5 to 20
Minimum initial investment
$10,000
Asset allocation ranges (%)
Minimum
Maximum
Cash
1%
50%
Australian Shares
10%
30%
International Shares
10%
30%
Australian Property
0%
5%
International Property
0%
5%
Australian Fixed Interest
30%
60%
International Fixed Interest
0%
20%
Alternatives
2%
10%
Other
0%
5%
Investment Objective
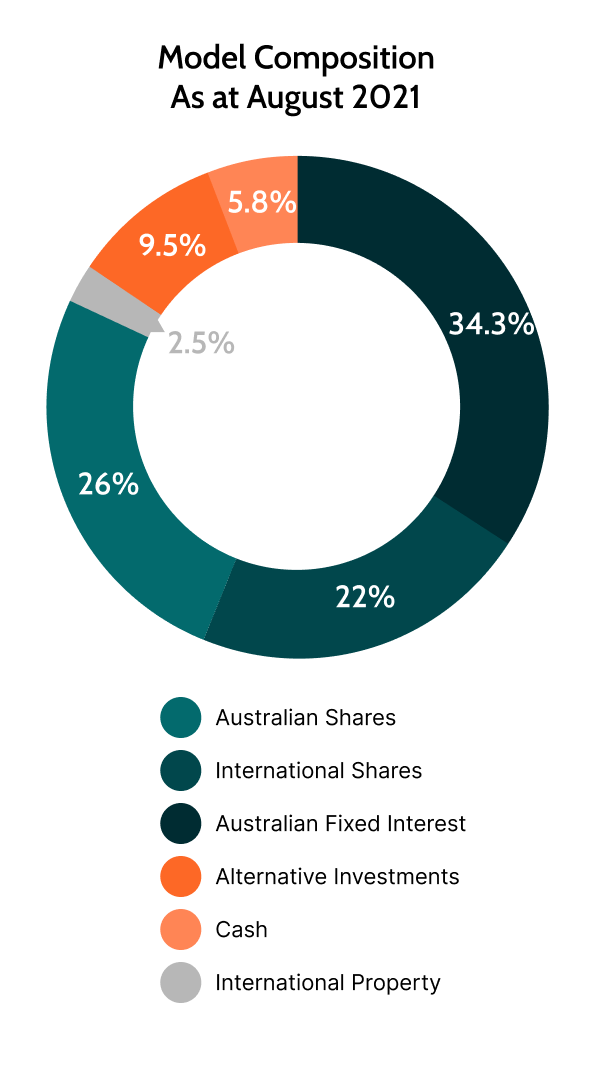
Balanced aims to return cash plus a margin of 2.25-2.75% pa over a rolling 4–7 year period. Cash is represented by the RBA cash rate. The portfolio is constructed to provide a balance between income and capital growth over the medium to long term. Based on an assessment of the macroeconomic outlook, the portfolio looks to rebalance in order to provide an optimal allocation between growth and defensive assets. The active management approach continually assesses the outlook for risk and returns.
Typical Investor
The Balanced portfolio is suitable for those investors looking for a combination of capital growth and income, over the medium to longer term, and have a moderate tolerance for variations in returns from year to year. They require an experienced manager with a long-established track record and active management process, through varied market cycles and risk environments. An investor who seeks a diversified, low cost, risk-based portfolio across multiple asset classes, and backed by leading non-bank macroeconomic research. The investor is looking to access a low-cost approach to manage a “Core” part of their wealth.
Investment Strategy and Approach
Alpine’s management process creates a risk based diversified portfolio that is actively managed. Within a balanced asset allocation framework, Alpine uses an in-house Tactical Equity Asset Allocation Model (TEAA), to actively increase or decrease exposure to risk assets based on the tactical outlook over a 1-6 month period. In simple terms we look to “time” key asset class movements based on risk and reward for the asset classes.
We in part use Longview Economics Research (London) timing models as part of this decision making process. This process helps us actively manage the allocation to equities, property, fixed interest (bonds, some hybrids), alternate asset classes (i.e. gold, commodities, currencies) and cash. There are no set limits on tactical rebalancing events, however typically tactical changes occur between 5 and 10 times per year. Historically rebalancing has occurred when changes are made or quarterly.

Indicative number of holdings
5 to 20
Minimum initial investment
$10,000
Asset allocation ranges (%)
Minimum
Maximum
Cash
1%
50%
Australian Shares
15%
35%
International Shares
15%
35%
Australian Property
0%
5%
International Property
0%
5%
Australian Fixed Interest
25%
55%
International Fixed Interest
0%
15%
Alternatives
5%
15%
Other
0%
5%
Investment Objective
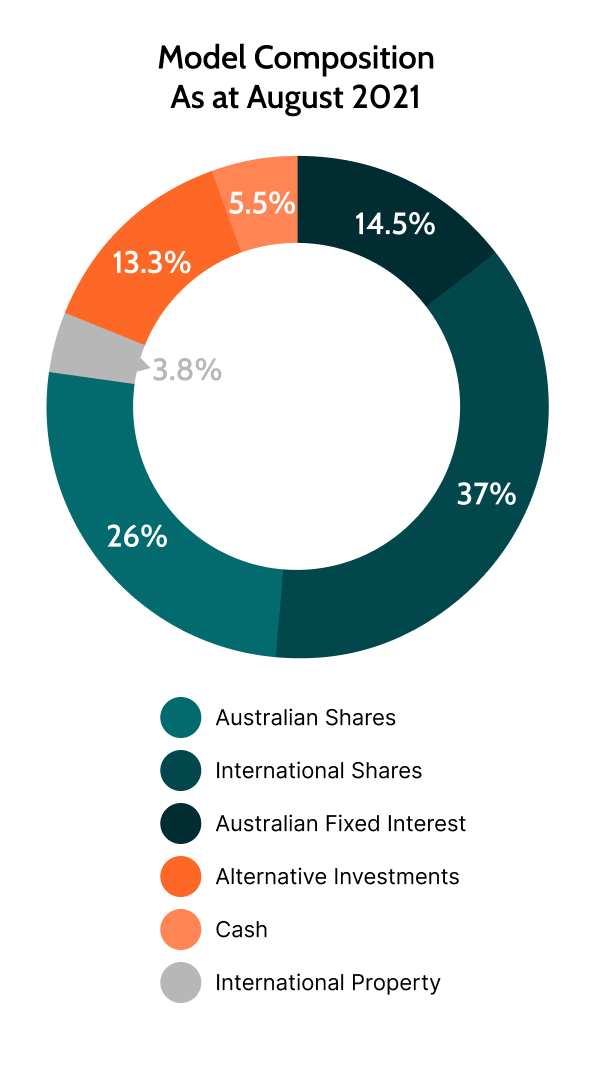
Growth aims to return cash plus a margin of 3.25-3.75% pa over a rolling 4–7 year period. Cash is represented by the RBA cash rate. The portfolio is constructed to provide a focus on growth with a small to medium allocation to income. Based on an assessment of the macroeconomic outlook, the portfolio looks to rebalance in order to provide an optimal allocation between growth and defensive assets. The active management approach continually assesses the outlook for risk and returns.
Typical Investor
The Growth portfolio is suitable for investors looking for capital growth with a small amount of income over the longer term. It suits investors that can accept short-term fluctuations in value, and variations in returns from year to year. They require an experienced manager with a long-established track record and active management process, through varied market cycles and risk environments. An investor who seeks a diversified, low cost, risk-based portfolio across multiple asset classes, and backed by leading non-bank macroeconomic research. The investor is looking to access a low-cost approach to manage a “Core” part of their wealth.
Investment Strategy and Approach
Alpine’s management process creates a risk based diversified portfolio that is actively managed. Within a Growth asset allocation framework, Alpine uses an in-house Tactical Equity Asset Allocation Model (TEAA), to actively increase or decrease exposure to risk assets based on the tactical outlook over a 1-6 month period. In simple terms we look to “time” key asset class movements based on risk and reward for the asset classes.
We in part use Longview Economics Research (London) timing models as part of this decision making process. This process helps us actively manage the allocation to equities, property, fixed interest (bonds, some hybrids), alternate asset classes (ie gold, commodities, currencies) and cash. There are no set limits on tactical rebalancing events, however typically tactical changes occur between 5 and 10 times per year. Historically rebalancing has occurred when changes are made or quarterly.

Indicative number of holdings
5 to 20
Minimum initial investment
$10,000
Asset allocation ranges (%)
Minimum
Maximum
Cash
1%
50%
Australian Shares
20%
40%
International Shares
20%
40%
Australian Property
0%
7.5%
International Property
0%
7.5%
Australian Fixed Interest
10%
20%
International Fixed Interest
0%
10%
Alternatives
5%
20%
Other
0%
5%
Investment Objective
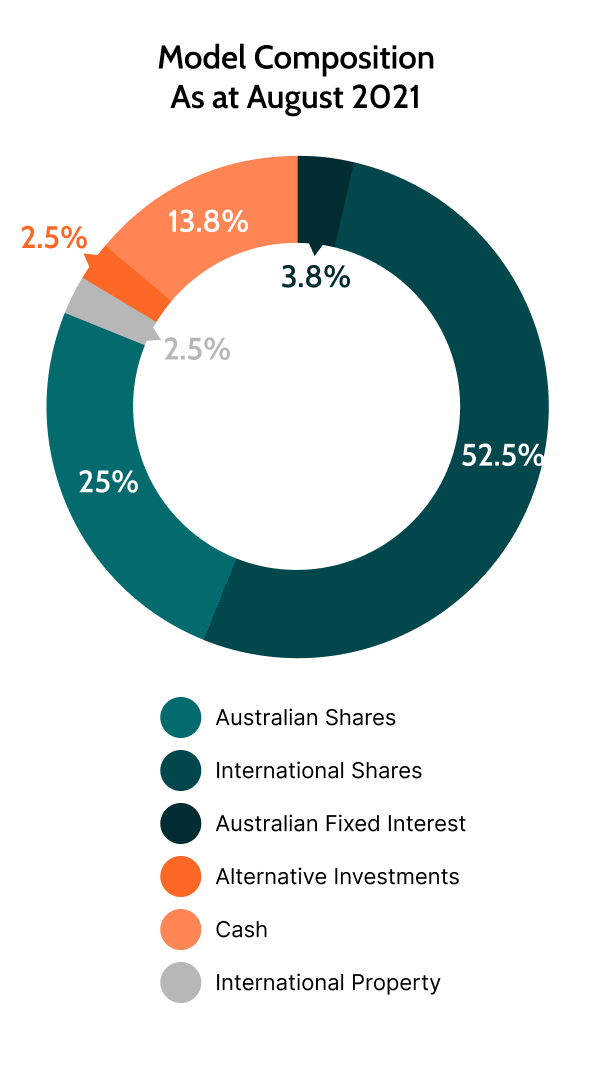
High Growth aims to return cash plus a margin of 4.0-4.5% pa over a rolling 7 year plus period. Cash is represented by the RBA cash rate. Holding minimal defensive positions, the portfolio aims to purely invest in a mix of growth assets. The portfolio aims to be fully invested (or close to) in normal markets, and only hold a weighting to cash is when transitioning between investments or in times of anticipated risk aversion. It will actively pursue unique growth options within asset classes, within its investment rules. Based on an assessment of the macroeconomic outlook, the portfolio looks to rebalance in order to provide an optimal allocation between growth assets. The active management approach continually assesses the outlook for risk and returns.
Typical Investor
The High Growth portfolio is suitable for investors looking for capital growth with little priority for income over the longer term. It suits investors that have a high tolerance for volatility in returns, and variations in returns from year to year. They require an experienced manager with a long-established track record and active management process, through varied market cycles and risk environments. An investor who seeks a diversified, low cost, risk-based portfolio with a priority for growth asset classes, backed by leading non-bank macroeconomic research. The investor is looking to access a low-cost approach to manage a “Core” part of their wealth.
Investment Strategy and Approach
Alpine’s management process creates a risk based diversified portfolio that is actively managed. Alpine’s management process creates a risk based diversified portfolio that is actively managed. Within a High Growth asset allocation framework, Alpine uses an in-house Tactical Equity Asset Allocation Model (TEAA), to actively increase or decrease exposure to risk assets based on the tactical outlook over a 1-6 month period. In simple terms we look to “time” key asset class movements based on risk and reward for the asset classes. We in part use Longview Economics Research (London) timing models as part of this decision making process. This process helps us actively manage the allocation to equities, property, alternate asset classes (ie gold, commodities, currencies), fixed interest (bonds, some hybrids) and cash. There are no set limits on tactical rebalancing events, however typically tactical changes occur between 5 and 10 times per year. Historically rebalancing has occurred when changes are made or quarterly.

Indicative number of holdings
5 to 20
Minimum initial investment
$10,000
Asset allocation ranges (%)
Minimum
Maximum
Cash
1%
25%
Australian Shares
20%
40%
International Shares
20%
60%
Australian Property
0%
10%
International Property
0%
10%
Australian Fixed Interest
0%
5%
International Fixed Interest
0%
5%
Alternatives
5%
20%
Other
0%
10%
Fee Calculator
* Past performance is no guarantee of future results.
+ + Since Inception on the 1st August 2012. Historical data prior to moving to OpenWealth in September 2021. Historically the model portfolios are rebalanced quarterly (31 Mar, 30 Jun, Sep and 31 Dec) and when changes to the portfolios are made. Historically performance is calculated as Total Shareholder Return, excluding costs, and therefore captures capital growth/loss + dividends (but excludes the benefit of franking credits).